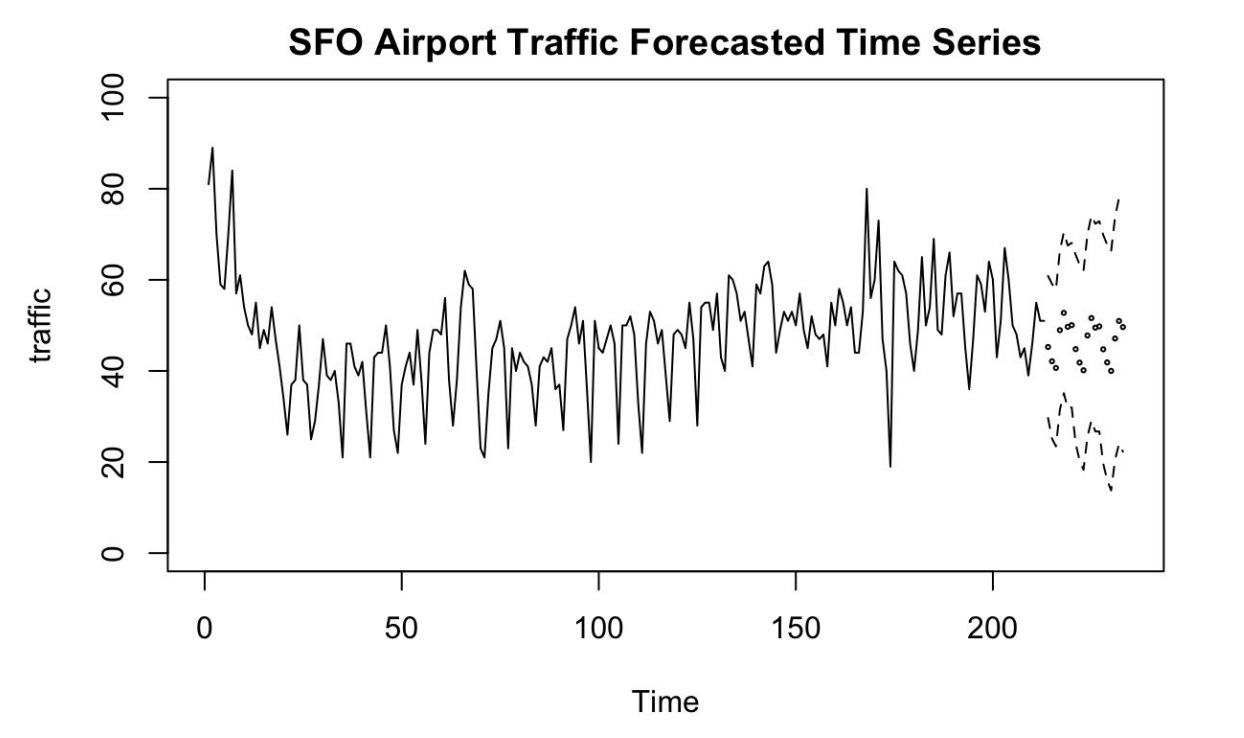
Monitoring Airport Traffic at SFO Intl During the Covid-19 Pandemic

Building off a previous rough estimation of Covid cases in San Mateo County to analyze percentages of airport traffic from the SFO International Airport to build a SARIMA time series model that forecasts future SFO airport traffic during the Covid-19 pandemic

Year
2020

Month
December

Line graph showing the forecasted traffic for San Francisco Airport over time. The x-axis represents time, and the y-axis represents traffic levels. The graph includes recent data points and forecasted future traffic with prediction intervals.
Multiple graphs including a time series residuals plot, and autocorrelation functions (ACF) and partial autocorrelation functions (PACF) showing analysis of residuals in a statistical model.
Side-by-side charts; left is a histogram titled 'Histogram Fit III' showing a bell-shaped distribution of 'res' values, right is a 'Normal Q-Q Plot' titled 'Normal Q-Q Plot' showing data points aligning along a diagonal line indicating normal distribution.