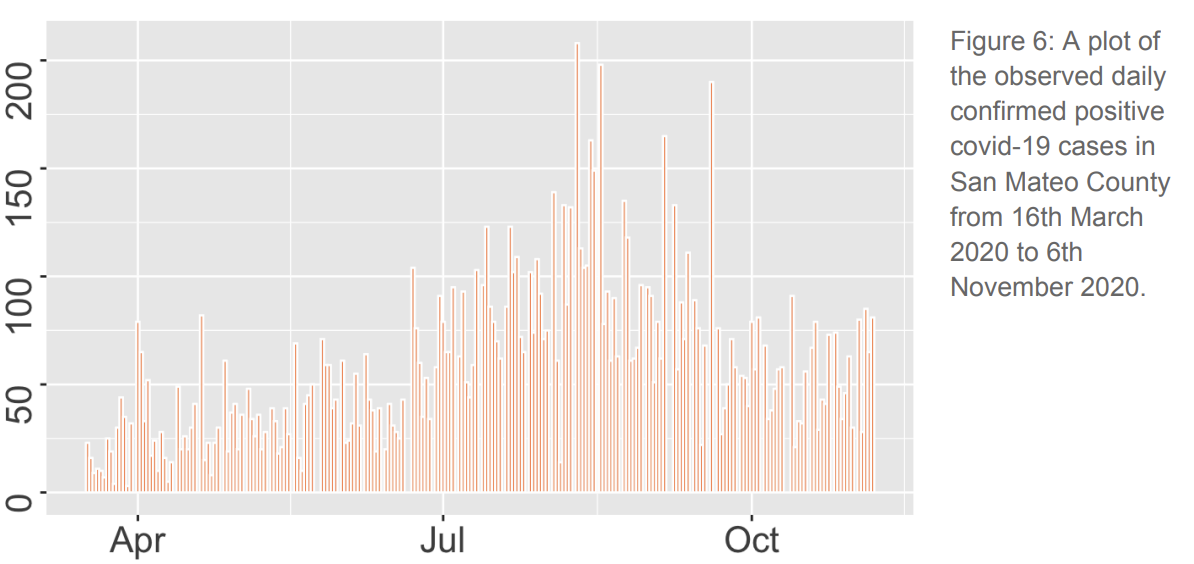
Rough Estimation of SARS-CoV-2 Confirmed Cases in San Mateo County

An analysis of the possible relationship between a time series model of airport traffic at the SFO International Airport and the rough estimation of SARS-CoV-2 confirmed cases in San Mateo County to predict future spikes in confirmed cases

Year
2020

Month
December

Map of California showing 7-day averaged daily confirmed COVID-19 cases per population, with counties color-coded from yellow to red based on ratio percentage. The color gradient indicates low to high case ratios, with some counties in red representing the highest ratios.
A line graph displaying de-trended and seasonalized time series data, with traffic flow values fluctuating around zero over a period of approximately 220 time units.
A line graph showing daily confirmed positive COVID-19 cases in San Mateo County from March 16, 2020 to November 6, 2020, with peaks around July 2020.